Financial Highlight
* Fiscal year ending on March 31.
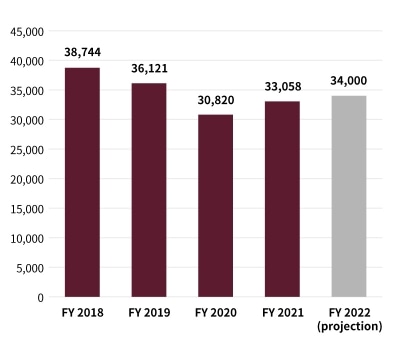
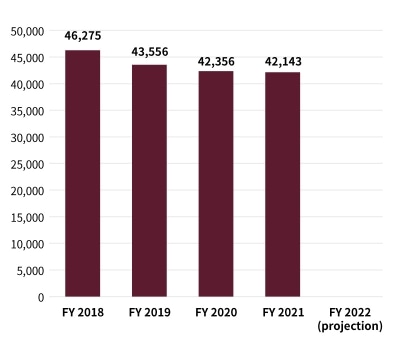
Sales amount
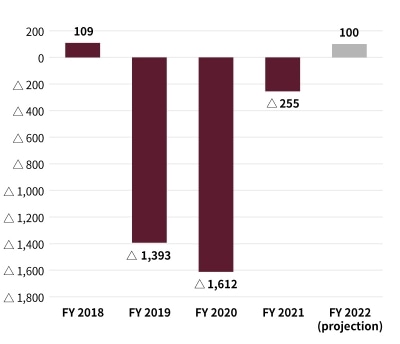
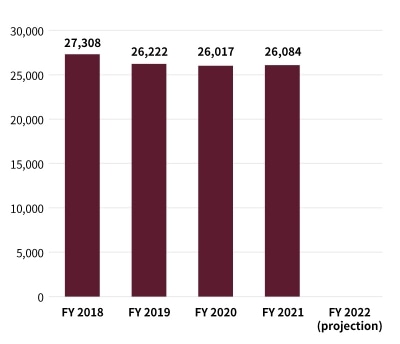
Operating income
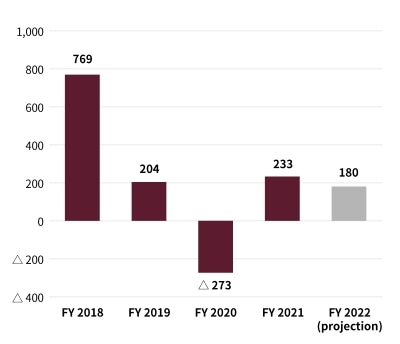
Net income
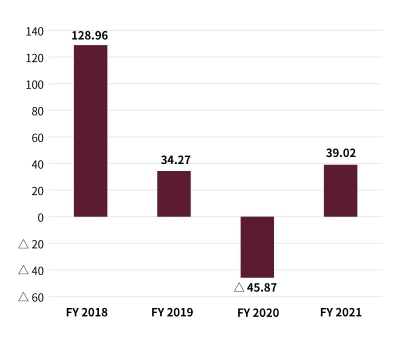
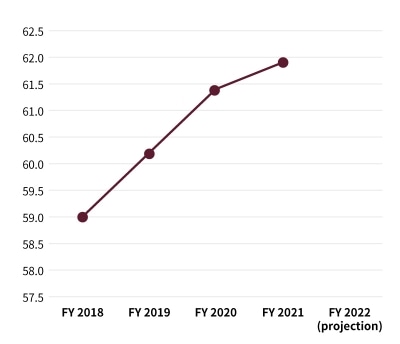
Net income per share
Total assets
Net worth
Capital ratio
* Fiscal year ending on March 31.